Decoding the Token BOM of Enterprise AI

Executive summary
An enterprise that runs its own AI inference manufactures its tokens rather than buying them, and that changes how the cost behaves. When tokens come from a vendor, the price is set and billed, so the buyer always knows the figure. When the enterprise produces them on its own infrastructure, no bill arrives, and nothing in the ledger says what producing a single token actually cost. The cost is real, but it sits spread across capital, power, software, and labor, where no single line reveals it.
This whitepaper presents the Token BOM, a fully-burdened bill of materials for a self-manufactured token. It breaks the cost into seven components, adjusts for how fully the factory runs and how many tokens are wasted, accounts for the way the cost falls over time, and maps the result into the TBM v5.0.1 taxonomy so it can be charged back to the business units that consume it.
The cost of a self-made token turns out to be decided less by the hardware than by how heavily that hardware is used. A factory running at forty percent utilization makes tokens at roughly double the cost of the same factory at eighty percent, because its fixed costs are spread across far fewer units. This is why most build-versus-buy cases that look cheaper than a commercial API are misleading. They are computed at full utilization, and they reverse once real utilization is applied.
1. Introduction
An API token has a price that someone else has already worked out. A vendor sets the rate, meters consumption, and sends an invoice, so the buyer always knows what a token cost. A self-manufactured token works differently. The enterprise builds it from its own capital, power, software, and people, and no invoice ever states what producing one token cost. The number exists, but it has to be constructed.
This is the position of any enterprise running its own AI inference on owned or long-term-leased infrastructure. Several kinds of organization are now in it: regulated industries that cannot send data outside their walls, sovereign and government deployments, and high-scale operations that have outgrown the markup on commercial APIs. Each has built an internal AI factory that manufactures tokens, and none of them receives a per-token cost in the mail.
A companion framework by Dinesh DM, the Cost Genome of Agentic AI, breaks down what it costs to run a single agent transaction. That framework addresses the consumption side, meaning what an enterprise spends when it uses intelligence. This paper addresses the production side, meaning what it costs to manufacture intelligence on infrastructure the enterprise owns. The two are halves of the same picture: one measures the cost of consuming a token, the other the cost of producing one.
The units a finance team would normally reach for do not answer the production question. API token cost is a billed figure, and owned infrastructure produces no bill. GPU-hour billing measures the time a machine ran rather than the tokens it produced, so it says nothing about output. Total cost of ownership measures the whole factory rather than the unit, which means it cannot tell a finance team what to charge a business unit that consumes the output.
Recent work has moved in this direction. The Levelized Cost of Artificial Intelligence, or LCOAI, brought a levelized cost to self-hosted models, much as the energy sector levelizes the cost of electricity. (Curcio, 2025.) It is a genuine step forward, though it answers a slightly different question, because it normalizes per inference rather than per token, treats power and cooling as future work, and is built for procurement comparison rather than internal chargeback. The Token BOM picks up where it leaves off. The TBM Council's own guide goes further still, mapping AI cost into the taxonomy at the architecture level, including the on-premises build, but it is candid about its own limit: it does not reach Level-2 granularity, and it notes that chargeback "requires additional tools, policies, and processes" that the guide does not provide. (TBM Council, 2024.) That is the gap this framework fills.
The Token BOM is a fully-burdened bill of materials for manufacturing a token on owned infrastructure. It breaks the manufacturing cost into seven components, adjusts for capacity absorption and yield loss, accounts for cost decay over time, and maps the result into the TBM v5.0.1 taxonomy for auditable chargeback. The unit it reports is cost per manufactured token.
A note on sources, numbers, and what a token means here. Sources are public where public sources exist, drawing on vendor and hardware references, standards documentation, and published research, all dated and listed at the end. The cost constants here are modeled and illustrative, and they are labeled that way throughout.
Unlike API pricing, which is published, the constants that decide a manufactured token's cost, such as real utilization, depreciation policy, power usage effectiveness, and yield, are internal to each enterprise and are not published anywhere. The contribution is the framework, and the numbers are illustrative shapes that each enterprise calibrates against its own ledger. Throughout, a manufactured token means an output token the model generates. Input, or prompt, tokens are part of the work the factory does, and they are absorbed into throughput and utilization rather than counted as separate units of output, because output length is what scales the cost of generation.
2. The shift from purchased to manufactured cost
Enterprise technology cost has moved through three visible transitions. Cloud moved infrastructure from capital purchase to operational subscription. SaaS moved applications from licensing to consumption. The API era moved AI from owned models to per-token consumption. In all three, the cost stayed something the enterprise purchased, arriving already priced from a vendor.
Self-hosting AI reverses that. It is a return to manufacturing, in which the enterprise builds the factory and carries the full burden of production: capital that has to be amortized, a building that has to be powered and cooled, a software platform that has to be licensed and run, a model that has to be maintained, and people who keep all of it alive. The cost of a token is the sum of these, absorbed into each unit of output.
The familiar units fit the purchased world rather than this one. GPU-hour, the unit inherited from high-performance computing and its schedulers, measures the time the machine ran, so two identical clusters at different utilization produce very different per-token costs from the same rate. (SchedMD; recharge-center practice under 2 CFR 200.468.) Per inference is better, because it is output-based, but an inference is not a token, since a reasoning model can emit hundreds of tokens in one inference while a classification call emits one. Total cost of ownership has the right scope and the wrong granularity: it tells the enterprise what the whole factory cost, but not what a single token cost or which business unit should pay for it.
This is why the framework is a bill of materials. In manufacturing, a BOM costs a product by breaking it into the components used to make one unit. The Token BOM is the fully-burdened, absorption-costing version of that idea. It has to include amortized capital and overhead, because a token has no direct materials of its own. Its cost is almost entirely absorbed capital, facility, platform, and labor, with only its energy genuinely variable.
3. The seven-component Token BOM
A single manufactured token draws cost from seven components. Each one is defined by production logic, meaning what it physically takes to make a token, rather than by an accounting category. They map cleanly into the TBM taxonomy in Section 6, but that mapping comes afterward, because the components are derived from production rather than from the ledger.
A line earns its place as a separate component only when it has both a distinct production driver and a distinct cost destination. That test, rather than a target number, is what produces seven. It is why Fabric is not folded into Silicon, since Fabric scales differently and lands in a different tower, and why power and cooling are a single Energy component, since they share one driver and one destination.
The seven are peers rather than a hierarchy. The two forces in Section 4, capacity absorption and yield loss, act across all of them, and cost decay acts on all of them over time. Each is described the same way: definition, scaling logic, illustrative shape, optimization levers, and TBM destination.
Component 1: Silicon
Definition. The accelerators that execute the forward pass, whether GPUs, TPUs, or inference-class processors. They are the dominant capital cost of the factory.
Scaling. Cost is per accelerator, amortized over its useful life, and the depreciation schedule is a first-order driver rather than an accounting footnote. The same accelerator depreciated over three years carries roughly double the per-period charge of one depreciated over six. The right schedule is genuinely contested. Through 2023 the major cloud providers converged on a six-year server life, which lowered their reported depreciation, on the argument that an accelerator moves through a useful life from frontier training to production inference to batch work. That consensus has since split. Amazon shortened the life of a subset of its servers from six years to five in 2025, citing the faster pace of AI hardware development, while others extended in the same period, and the question of whether long schedules understate the true cost has drawn public scrutiny. (Amazon, 2025.) The practical point is that the schedule is a decision the enterprise has to make and defend, not a number it inherits, and the schedule it chooses changes the numerator of every token it manufactures.
Reference shape (illustrative). An accelerator acquired in the tens of thousands of dollars, amortized over three to six years, produces a fixed per-period capital charge. Divided across tokens, this charge dominates the BOM at low and moderate utilization and recedes only when the factory runs hot.
Optimization levers. The main levers are the depreciation schedule, set within accounting policy; accelerator selection matched to the workload, choosing inference-class parts rather than training-class where the work allows; and above all utilization, covered in Section 4, since the capital charge is fixed and only higher volume reduces it per token.
TBM destination. Hardware cost pool, AI Compute resource tower.
Component 2: Fabric
Definition. The interconnect and control plane that bind the accelerators into a working cluster. It covers high-speed networking, the head and control nodes, and the local high-performance storage that feeds the accelerators.
Scaling. Cost is per node and per accelerator served, amortized as capital. It grows faster than linearly with cluster size for multi-node training and large-model serving, because the accelerators have to coordinate constantly, and that coordination costs more as the model and the cluster grow. It is the cost of making many accelerators behave as one.
Reference shape (illustrative). For single-node inference, fabric is a small addition to silicon. For multi-node serving of large models, it becomes a meaningful fraction of the capital base, and in the largest factories it rivals the accelerators themselves.
Optimization levers. The levers are topology choice, keeping a model within a single node where its size allows, batching to amortize fabric overhead across more tokens, and right-sizing the cluster to the model's actual parallelism rather than its peak.
TBM destination. Hardware cost pool, Network and Storage resource towers, with the control plane in AI Compute.
Component 3: Facility
Definition. The physical plant that houses the factory, including data center space, racks, the building shell, and the fixed mechanical and electrical infrastructure, whether owned or leased.
Scaling. Cost is fixed capital or a fixed lease, largely independent of token volume in the short run, and it is allocated per rack or per kilowatt of provisioned capacity. This is the purest fixed-overhead component in the BOM, which makes it the one most exposed to under-absorption when the factory sits idle.
Reference shape (illustrative). A fixed monthly cost per rack or per provisioned kilowatt, incurred whether or not the accelerators are busy.
Optimization levers. The levers are the choice between colocation and an owned build, higher density in the form of more accelerators per rack and per square meter, and matching provisioned capacity to what is actually deployed rather than to a growth forecast.
TBM destination. Facilities and Power cost pool, Data Center.
Component 4: Energy
Definition. The electricity that runs the accelerators and the cooling that removes their heat. This is the variable operating cost of production.
Scaling. Cost is variable, roughly proportional to accelerator activity, and amplified by power usage effectiveness. At a PUE of 1.5, every watt delivered to compute draws one and a half watts from the grid. Energy couples most directly to capacity absorption, because a busy factory burns more energy but spreads its fixed cost across more tokens, while an idle factory burns little energy yet still wastes its entire fixed base.
Reference shape (illustrative). Each accelerator-hour of active compute draws somewhere from several hundred watts to roughly a kilowatt for high-end parts, charged at the regional electricity rate and multiplied by PUE. This is the one component that is genuinely marginal per token.
Optimization levers. The levers are reducing PUE through cooling efficiency, scheduling flexible work into off-peak power rates, power-capping the accelerators, and locating the factory where power is cheap and clean.
TBM destination. Facilities and Power cost pool.
Component 5: Platform
Definition. The software that turns raw hardware into a serving factory, which includes the inference engine, the scheduler and orchestrator, the cluster manager, and the model weights and licenses themselves.
Scaling. Platform cost is a mix of fixed licensing and per-node or per-deployment fees. An open-source stack carries no license cost but pushes that cost into Operations (Component 7), while a commercial stack carries the license cost and reduces operations in return. Model licenses may be fixed, per-deployment, or revenue-shared.
Reference shape (illustrative). A per-cluster or per-node software cost plus any model licensing, largely fixed relative to token volume. The serving engine's efficiency matters beyond its own line, because a more efficient engine produces more tokens per accelerator-second, which lowers every other component per token.
Optimization levers. The levers are the open-versus-commercial tradeoff, read against operations cost; the efficiency of the serving engine; and consolidating multiple models onto shared serving infrastructure.
TBM destination. Software and SaaS cost pool, AI Models and Platform resource towers.
Component 6: Model Lifecycle
Definition. The recurring cost of keeping the model fit to produce useful tokens, through fine-tuning, retraining, and evaluation. This is not the one-time cost of standing the model up, but the ongoing cost of maintaining it.
Relationship to the Cost Genome paper. Fine-tuning and evaluation also appear in the consumption-side Cost Genome, so the two frameworks must not double-count, and they do not. The Cost Genome counts the marginal cost of a single evaluation or tuning run, charged to the one transaction that triggered it. The Token BOM counts the amortized maintenance cost spread across every token the model produces over its deployment life. The same activity is marginal in one view and absorbed in the other, and that difference in accounting is what keeps the two frameworks complementary.
Scaling. Cost is recurring compute and labor, amortized across the token volume produced between cycles. A model retrained monthly carries a higher per-token lifecycle charge than one retrained annually, because the same maintenance spend is spread over fewer tokens between cycles.
Reference shape (illustrative). Periodic training and evaluation compute, valued at the factory's own internal rate or at burst cloud rates, plus the associated labor, divided by the tokens produced between cycles.
Optimization levers. The levers are tying the retraining cadence to measured drift rather than the calendar, using adapter and low-rank tuning in place of full retraining where it suffices, and running stratified evaluation that tests high-risk categories often and the full set less often.
TBM destination. Cloud Services and AI Compute for training compute, Labor for tuning and evaluation staff.
Component 7: Operations
Definition. The human labor that keeps the factory running, covering platform engineering, site reliability, and machine-learning operations, along with monitoring, incident response, capacity planning, and upgrades.
Scaling. Cost is largely fixed headcount, allocated across token volume. Like Facility, it is a fixed overhead exposed to under-absorption, because the same team runs a busy factory or an idle one, so its cost per token falls only as volume rises.
Reference shape (illustrative). The fully loaded cost of the platform team, or the allocated fraction of it, divided by tokens produced. It is material at low volume and negligible per token at high volume.
Optimization levers. The levers are automation, consolidating multiple factories under one team, and the managed-platform tradeoff, which shifts cost into Platform (Component 5).
TBM destination. Labor and Staffing cost pool.
How the components interact
The seven are peers, and making a single token draws on all of them at once. Silicon executes, fabric feeds, facility houses, energy powers, platform serves, lifecycle keeps the model current, and operations keeps the whole thing alive.
The mix varies from one factory to another. A small single-node deployment is dominated by Silicon and Operations, because fixed costs are spread across low volume. A large multi-node factory running hot is dominated by Silicon and Energy. A heavily regulated or fast-evolving deployment sees Model Lifecycle grow. The framework assumes no fixed proportions; instead it makes each component visible, so the team can see which one moved the per-token cost.
One feature of the mix matters more than the rest. Five of the seven components are fixed or capital, namely Silicon, Fabric, Facility, Platform, and Operations. Only Energy is genuinely variable per token, and Model Lifecycle is recurring but lumpy. Because fixed cost dominates, it is utilization, rather than any single line item, that decides the unit cost. That is the subject of Section 4.
4. Capacity absorption and yield loss
The naive cost per token divides the total BOM cost by the factory's theoretical maximum output. That number is always wrong, and always too low, because the factory never runs at its theoretical maximum and never wastes nothing. Two forces separate the real cost from this floor, and a third moves it over time.
Capacity absorption, the utilization force
Because five of the seven components are fixed, the per-token cost depends overwhelmingly on how many tokens the fixed cost is spread across. This is absorption costing, where fixed overhead is absorbed by the units produced. When the factory runs below capacity, the fixed cost is under-absorbed, and the cost of each unit rises to carry the unused capacity.
The effect is large. A factory at forty percent utilization makes tokens at roughly double the cost of the same factory at eighty percent, even with identical hardware and identical components, because the same fixed cost is divided across half as many tokens. The difference does not show up in any single line of the BOM. It is a capacity variance, a property of the factory's idleness rather than of any component, and it stays invisible to a cost model that does not name it.
Figure 1 shows the effect on the illustrative factory from Appendix A. The curve is steep at low utilization and flattens as the factory fills, and the point where it crosses the price of a comparable commercial API is the point that decides build versus buy.
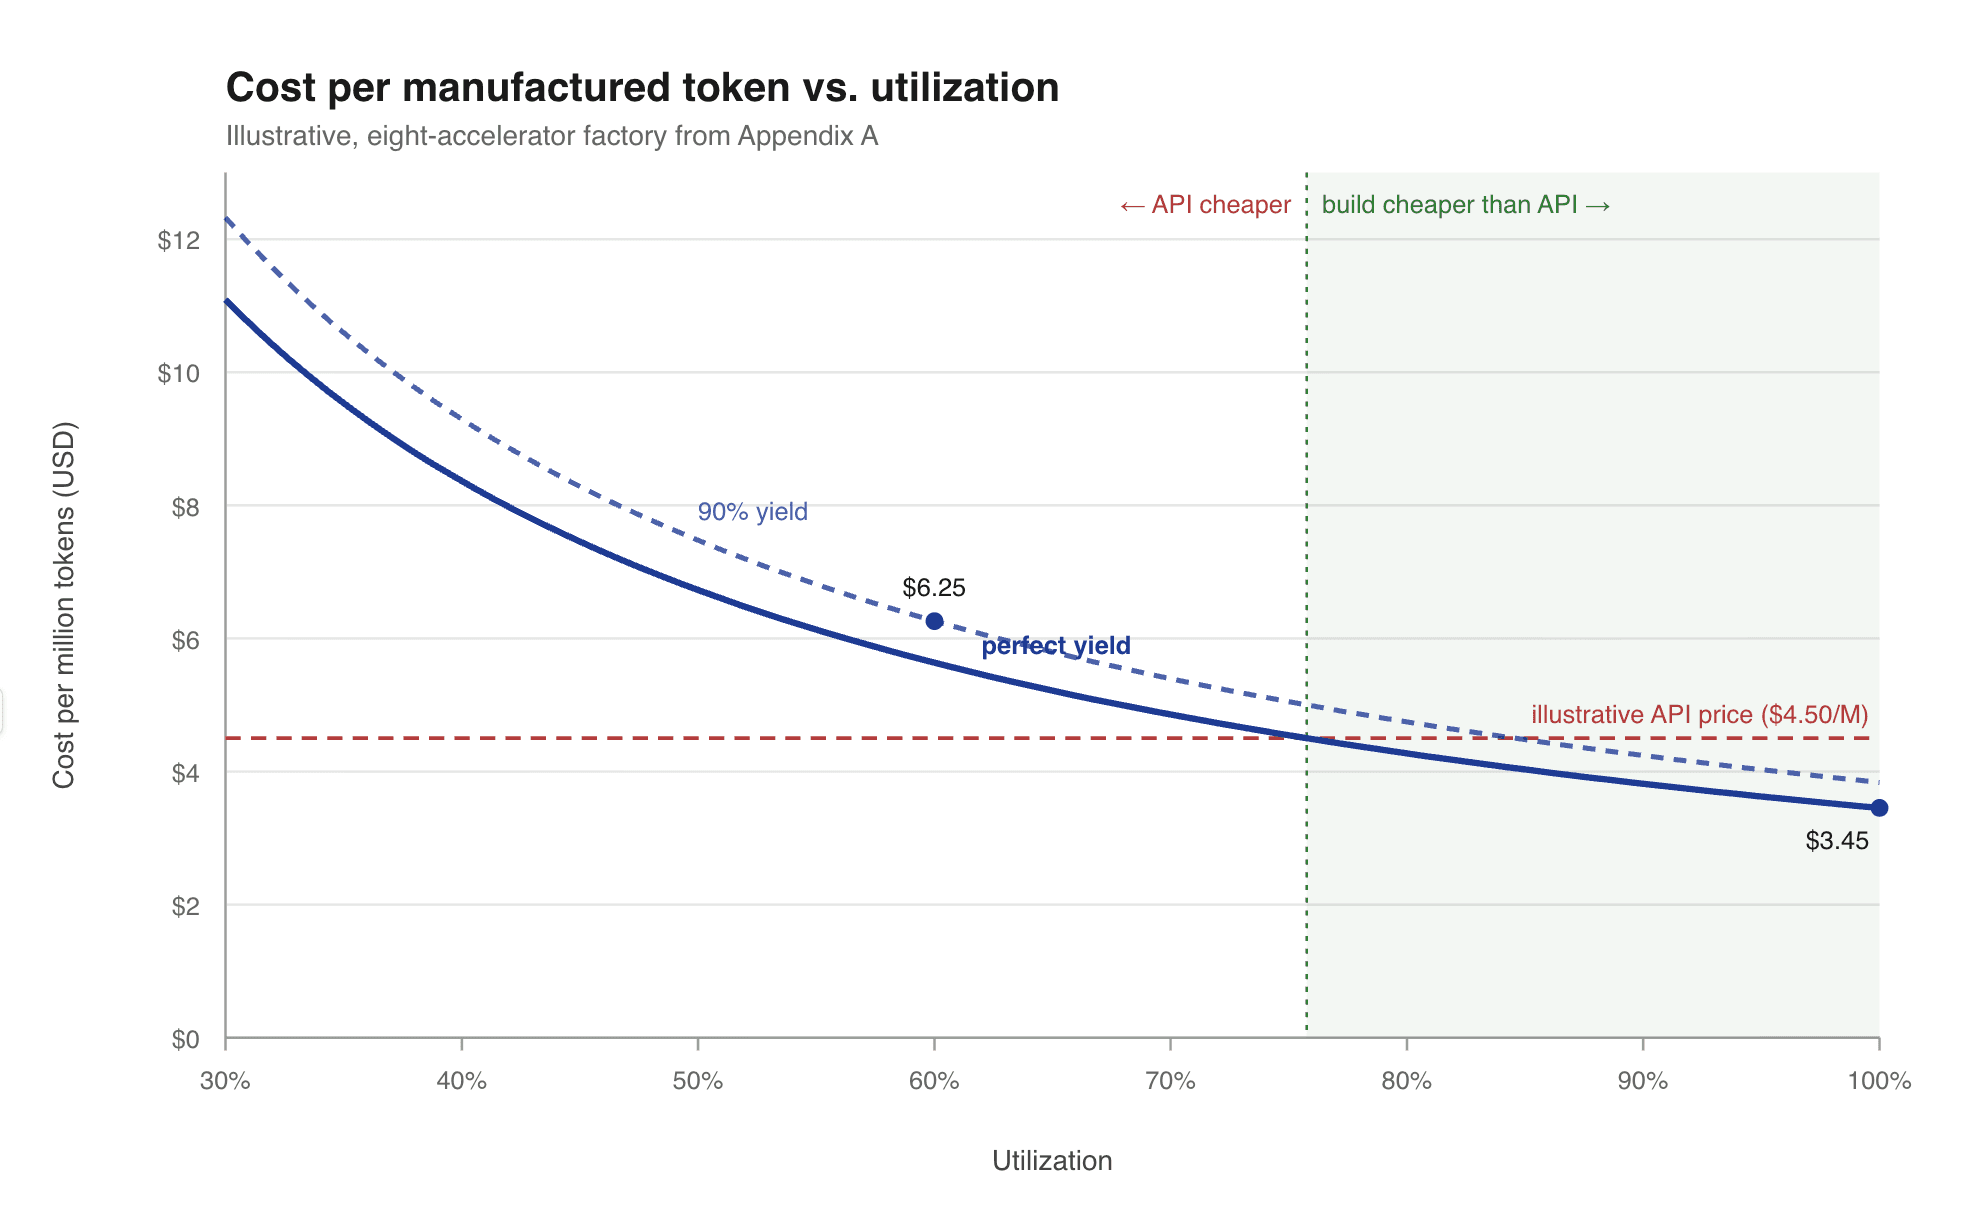
Figure 1. Cost per manufactured token versus utilization, for the illustrative factory in Appendix A. Below the crossover with a commercial API price, the self-hosted token costs more than buying it. Numbers are illustrative.
This is the production-side counterpart to the Cost Genome's reliability multiplier, the way retries and failovers raise the cost of a transaction, and the two work in opposite directions. Reliability adds cost in the numerator, because retries and failovers spend more to produce the same result. Under-utilization removes tokens from the denominator, because the same spend produces fewer units. Both push the unit cost up, from opposite ends of the same fraction.
Yield loss, the yield force
Not every manufactured token is a good token. Tokens spent on failed generations, discarded outputs, and completions that do not pass evaluation are scrap, and as in any factory, the cost of scrap is borne by the good units. A factory with fifteen percent yield loss has to recover its full BOM cost across the eighty-five percent of output that is useful, which raises the cost of each delivered token.
Yield loss is distinct from under-utilization, and the two do not double-count. Under-utilization is capacity that never produced a token. Yield loss is capacity that produced a token and then discarded it. Idle capacity wastes only the fixed base, while scrap wastes the fixed base and the variable energy spent generating it, so they are different wastes, and a single token can suffer both. The levelized-cost work captures part of this by counting only valid inferences, and the Token BOM goes one step further by making yield an explicit factor and tying it to the token rather than the inference.
The corrected unit cost
The cost per manufactured token is the fully-burdened BOM cost divided by the good tokens actually delivered, and the count of good tokens is the theoretical capacity reduced by both utilization and yield.
Cost per manufactured token = total BOM cost ÷ (theoretical token capacity × utilization × yield)
The floor divides by the theoretical capacity alone, which assumes full utilization and perfect yield. In practice the denominator is smaller, because both utilization and yield shrink it, so the real cost never reaches the floor. That gap is the most important thing the framework measures.
Cost decay, the time force
The manufactured cost falls over time even when nothing in the factory changes. Newer accelerators deliver more tokens per watt and per dollar, depreciation schedules front-load or back-load the capital charge across a part's life, and energy efficiency improves. As a result, a token made in the fourth quarter can cost materially less than the same token in the first, on the same nominal hardware. This breaks naive chargeback, because a fixed internal price set in January over-charges every consumer by December. The BOM has to be re-struck on a set cadence, and chargeback has to reference the current BOM rather than a stale one.
The chargeback consequence
Absorption changes who should pay what. A business unit that drives the factory to high utilization lowers the unit cost for everyone, while a unit that reserves capacity it does not use raises it. Absorption-aware chargeback therefore allocates the capacity variance to the consumer that reserved and did not use, the same way cloud cost management allocates over-provisioning to the team that over-provisioned. The principle is simple: reward absorption, charge idleness.
A limit worth stating
Real utilization, yield, and decay rates for production AI factories are not public, because they live on internal dashboards inside the enterprises running these factories. The framework still holds, but its constants do not transfer, so each enterprise has to measure its own.
5. The unit metric: cost per manufactured token
Cost per manufactured token is the unit the framework reports. It is the fully-burdened Token BOM cost, adjusted for capacity absorption and yield loss, divided by the count of good tokens delivered. It is the production-side counterpart to the Cost Genome's cost per successful task, which is the consumption-side metric of total spend divided by successful completions.
It is easy to confuse with three neighbors, so the differences are worth stating once. Against the purchased cost per token of a commercial API, the difference is margin and absorption, because the API price already includes the vendor's margin and the vendor's own absorption at the vendor's utilization, while the manufactured cost carries no margin and reflects the enterprise's own absorption at its own utilization. The two are comparable only when the manufactured cost is computed at real utilization rather than theoretical capacity. Against the per-inference figure of the levelized-cost work, the difference is the denominator, because cost per manufactured token captures output length while per-inference averages over it. Against GPU-hour, the difference is input versus output, because GPU-hour prices the time the machine ran, while cost per manufactured token prices the output, with utilization and yield already absorbed.
What the metric is for. It supports the honest build-versus-buy decision, comparing the manufactured cost at real utilization to the market price, and it supports internal chargeback and capacity planning.
What it is not. It is not a quality or value metric. A low manufactured cost produced by a poorly-tuned model that emits verbose, low-value tokens is a false economy. Like cost per successful task, it belongs in a portfolio of metrics rather than standing on its own, and the discipline lies in defining what counts as a good, yield-passing token.
6. TBM v5.0.1 mapping and chargeback
Each component routes into a TBM line, which turns the manufactured-token cost into a business-unit chargeback.
Technology Business Management, or TBM, is the standard framework for classifying technology cost in business terms, and it is maintained by the TBM Council. The reference taxonomy here is TBM v5.0.1, published in July 2025. (TBM Council, 2025.) It organizes technology cost across four layers: Cost Pools, the source of spend; Resource Towers, where the spend is applied; Solutions, what is delivered; and Consumers, who consumes it. Two properties matter here. Artificial Intelligence is a Solution category rather than a Resource Tower, so manufacturing cost distributes across several towers and rolls up to the AI Solution. And cloud spend lands in Cloud Services rather than in a dedicated public-cloud pool.
Table 1. Token BOM components mapped to the TBM v5.0.1 taxonomy.
Component | Cost Pool | Resource Tower | Solution |
Silicon | Hardware | AI Compute | Artificial Intelligence |
Fabric | Hardware | Network, Storage, AI Compute | Artificial Intelligence |
Facility | Facilities and Power | Data Center | Artificial Intelligence |
Energy | Facilities and Power | Data Center | Artificial Intelligence |
Platform | Software and SaaS | AI Models, Platform | Artificial Intelligence |
Model Lifecycle | Cloud Services, Labor | AI Compute, Data Operations | Artificial Intelligence |
Operations | Labor and Staffing | Cross-tower | Artificial Intelligence |
The seven production-logic components map onto the existing cost pools without forcing. The fit is clean because the production logic and the financial taxonomy describe the same factory from two directions, and since the components were derived from production rather than from the cost pools, that clean mapping is a finding rather than an assumption.
The TBM Council's own guide showed this structure at the architecture level, in a worked on-premises example that routed hardware, facilities and power, cloud, and labor through compute and storage towers into an AI solution consumed by a business unit. (TBM Council, 2024.) The Token BOM adds what that example left for later, namely the Level-2 granularity and the per-token derivation beneath the structure.
The chargeback mechanism
The mapping is structural, and turning it into chargeback, the step the prior guide left to additional tools and processes, takes three things.
Allocation keys. Tokens consumed per business unit per model, with the capacity variance allocated to consumers that reserved capacity and did not use it. Tokens are the demand signal, and reserved-but-idle capacity is the cost driver that token counts alone would miss.
Reconciliation. The computed manufactured cost is a model, and the ledger is the truth: the depreciation actually booked, the energy actually invoiced, the payroll actually paid. The BOM and the ledger have to tie out on a recurring cadence, or the manufactured cost becomes a number no one trusts.
Ownership. Each component needs an owner. Silicon, Fabric, Facility, and Energy typically sit with infrastructure, Platform and Model Lifecycle sit with the AI platform team, and Operations sits with the platform team as well. Without explicit ownership, the BOM is a report rather than a control.
The result is AI as a Solution, consumed by business-unit Consumers, charged at a manufactured-token rate that is auditable against the ledger and aware of absorption.
7. The metering bridge
To compute the BOM, an enterprise needs data that the factory does not produce in one place. The inputs sit in four systems that do not talk to each other. Per-accelerator utilization and power come from infrastructure telemetry. Facility power and PUE come from the building management system. Token counts by model and by consumer come from the serving-engine logs. Yield, the split between good and scrapped tokens, comes from evaluation and serving telemetry. And the financial constants, the depreciation schedule, the lease, the payroll, and the licenses, come from the finance ledger.
No standard joins these into a manufactured-token cost. This is the production-side counterpart to the Cost Genome's observability bridge, the gap between technical traces and financial systems. The consumption side needs trace data to flow into finance, and the production side needs telemetry, building data, serving logs, and the ledger to converge on a single per-token cost.
The standards direction is visible but incomplete. The OpenTelemetry generative-AI conventions carry token counts but define no cost attribute. (OpenTelemetry, 2026.) FOCUS has no manufactured-token column, because there is no invoice to normalize. A standard way to emit utilization, yield, and a per-token production cost would let the BOM compute itself, and until that exists, the bridge is built per enterprise.
8. What technology and finance leaders should do
Meter the factory, not the bill. The manufactured cost cannot be read off an invoice, because there is no invoice, so instrument utilization, power, yield, and token counts from the first day of production.
Decompose the BOM rather than reporting a single AI infrastructure line. Each component carries a distinct signal. Silicon rising means a hardware change or a schedule change, energy rising means utilization or PUE moved, and Model Lifecycle rising means the retraining cadence increased. A single line hides all of it.
Treat utilization as a chargeback driver. Reward absorption and charge idleness, allocating the capacity variance to the consumer that reserved capacity and did not use it.
Re-strike the BOM on a cadence. Cost decay makes a static internal price wrong within quarters, so chargeback should reference the current BOM rather than last year's.
Make build-versus-buy honest. Compare the manufactured cost at your real utilization to the market price, not the manufactured cost at theoretical capacity, because most build cases that look cheaper than an API are computed at full utilization and fall apart at forty percent. A recent cost-benefit analysis of on-premise deployment reaches the same conclusion, finding that the break-even point depends heavily on sustained volume. (Pan et al., 2025.)
Budget Model Lifecycle as a recurring cost from year one. It is not a one-time stand-up expense, and it grows as the model matures and the deployment surface expands.
Getting started: a short checklist
Name an owner for the BOM, jointly held by infrastructure, the AI platform team, and FinOps.
Instrument the four data sources in Section 7: utilization and power, facility and PUE, token counts by consumer, and yield.
Pull the financial constants from the ledger, namely the depreciation schedule, the lease, the payroll, and the licenses.
Compute the seven components and the absorption-and-yield-adjusted cost per manufactured token, using the formula in Section 4.
Reconcile the modeled BOM against the actual ledger on a set cadence.
Set chargeback at the current manufactured-token rate, with the capacity variance allocated to consumers that reserved and did not use.
Re-strike the BOM each quarter, and rerun the build-versus-buy comparison at real utilization.
9. Conclusion
The Token BOM is a fully-burdened bill of materials for manufacturing a token on owned infrastructure. It has seven components, Silicon, Fabric, Facility, Energy, Platform, Model Lifecycle, and Operations, adjusted by capacity absorption and yield loss, decaying over time, and mapped into the TBM v5.0.1 taxonomy for auditable chargeback. The unit it reports is cost per manufactured token. It is the production-side companion to the consumption-side Cost Genome, where one framework measures the cost of using intelligence and the other the cost of producing it.
The framework is deliberate about what it does not claim. It does not reinvent the amortization of capital, which the depreciation literature already covers. It does not reinvent the levelized-cost idea, which the levelized-cost work owns. It does not reinvent the taxonomy, which the TBM Council owns. And it does not reinvent the chargeback function, which high-performance computing recharge centers and IT financial management tools have run for decades. It builds on all of these. What it adds is the join that none of them made: a per-token, fully-burdened, absorption-aware and yield-aware manufacturing cost, mapped into TBM for chargeback, for the enterprise that runs its own factory.
Open requirements
The framework is incomplete in three areas, all of which depend on work outside its scope. Production constants are not public, because real utilization, yield, and decay rates live on internal dashboards, though benchmarks may emerge as the discipline matures, much as cloud cost benchmarks did over the past decade. The metering bridge is not standardized, because the OpenTelemetry attributes carry token counts but no cost attribute, FOCUS reports purchased tokens as a billing currency but has no concept of a manufactured-token cost, and the join across telemetry, building data, serving logs, and the ledger is built per enterprise. And reconciliation tooling is immature, because tying the modeled BOM to the actual ledger on a recurring cadence is still manual today.
Validity over time
The structural elements, the seven components, the absorption and yield forces, the decay dynamic, and the TBM mapping, are built to stay stable as the technology and its prices change. The constants will need calibration and refresh, and the framework is designed to accommodate that without redesign.
Appendix A: Illustrative reference cost model
This worked example uses round, illustrative numbers to show how the seven components and the absorption and yield adjustment produce a cost per manufactured token. The numbers are not measurements. They are meant to show the shape of the calculation and the size of the absorption effect.
Consider a small factory of eight inference accelerators serving a mid-sized model.
Table 2. Monthly fully-burdened component cost, at sixty percent utilization.
Component | Basis | Monthly cost |
Silicon | 8 accelerators at $30,000, amortized over 48 months | $5,000 |
Fabric | 25% of silicon | $1,250 |
Facility | Fixed rack and plant | $1,000 |
Energy | 8 kW at the wall after PUE 1.5, at 60% utilization, $0.12/kWh | $450 |
Platform | Serving and orchestration licenses | $1,500 |
Model Lifecycle | Amortized recurring tuning and evaluation | $1,000 |
Operations | Allocated platform-team labor | $4,000 |
Total | $14,200 |
At two hundred tokens per second per accelerator, eight accelerators produce one thousand six hundred tokens per second, which is roughly 4.2 billion tokens over a month at full utilization. One technical input drives that capacity figure, and that is throughput per accelerator, here two hundred tokens per second. That single number absorbs the inference detail behind it, including model size, batch size, sequence length, and quantization, and the enterprise measures it on its own serving stack rather than deriving it here.
Energy is the one component that moves with utilization, so the total moves with it. At full utilization the energy line rises to about $750, which lifts the total to about $14,500.
Applying the formula from Section 4, where theoretical capacity is about 4.2 billion tokens per month:
At full utilization and perfect yield: $14,500 ÷ (4.2B × 1.0 × 1.0), which is $14,500 ÷ 4.2B, or about $3.45 per million tokens.
At sixty percent utilization and ninety percent yield: good tokens are 4.2B × 0.6 × 0.9, or about 2.27 billion, so the cost is $14,200 ÷ 2.27B, or about $6.25 per million tokens.
It is the same factory in both cases, yet the unit cost nearly doubles, because the full-utilization case spreads a slightly higher total across a far larger number of good tokens while the under-used case spreads its cost across far fewer. At sixty percent utilization, this self-hosted factory may make tokens at a cost above a commercial API. The build case wins only when the factory runs hot, which means the absorption effect, rather than the hardware, decides the economics. Figure 1 plots this relationship across the full utilization range.
Appendix B: Glossary
Token BOM. A fully-burdened bill of materials for manufacturing a token on owned infrastructure, broken into seven cost components.
Manufactured token. An output token the model generates. Input, or prompt, tokens are absorbed into throughput and utilization, not counted as separate units of output.
Technology Business Management (TBM). The standard framework for classifying technology cost in business terms. It organizes cost across Cost Pools, Resource Towers, Solutions, and Consumers.
Capacity absorption. The spreading of fixed cost across units produced. When a factory runs below capacity, fixed cost is under-absorbed and the unit cost rises.
Capacity variance. The portion of unit cost attributable to unused capacity. It shows up in no single component, because it is a property of idleness.
Yield loss. The share of manufactured tokens that are not useful, from failed generations, discarded outputs, or completions that do not pass evaluation. The cost of scrap tokens is borne by the good ones.
Cost decay. The fall in manufactured cost over time as hardware efficiency improves and capital charges shift, independent of any change in the factory.
Cost per manufactured token. The fully-burdened BOM cost, adjusted for capacity absorption and yield loss, divided by good tokens delivered.
PUE. Power Usage Effectiveness. The ratio of total facility power to power delivered to compute.
Resource Tower. In the TBM taxonomy, a category of technology resources organized by function.
References
Amazon.com, Inc. (2025). Form 10-Q, quarter ended March 31, 2025. U.S. Securities and Exchange Commission, EDGAR. https://www.sec.gov/edgar/search/
Curcio, E. (2025). Introducing LCOAI: A Standardized Economic Metric for Evaluating AI Deployment Costs. arXiv:2509.02596. https://arxiv.org/abs/2509.02596
FinOps Foundation. (2025). FOCUS Specification v1.2. https://focus.finops.org/
FinOps Foundation. FinOps for AI Overview. https://www.finops.org/wg/finops-for-ai-overview/
OpenTelemetry. Semantic Conventions for Generative AI. https://opentelemetry.io/docs/specs/semconv/gen-ai/
Pan, G., Chodnekar, V., Roy, A., and Wang, H. (2025). A Cost-Benefit Analysis of On-Premise Large Language Model Deployment: Breaking Even with Commercial LLM Services. arXiv:2509.18101. https://arxiv.org/abs/2509.18101
SchedMD. Slurm Workload Manager. https://slurm.schedmd.com/
TBM Council. (2024). TBM for AI Value Realization.
TBM Council. (2025). TBM Taxonomy Version 5.0.1. https://www.tbmcouncil.org/taxonomy/
U.S. Office of Management and Budget. Uniform Guidance, 2 CFR 200.468, Specialized service facilities. https://www.ecfr.gov/
DM, Dinesh. Decoding the Cost Genome of Agentic AI.